A solar panel needs direct sunlight in order to work best. When clouds or trees block the sun, the solar panel generates less power than if it had full sunlight. When engineers design solar powered homes or applications they know it is important to install a solar panel in a location that will get the most direct sunlight.
If you are under 18 years old, get permission from an adult to do this experiment.
Science Fair Project Idea/ Objective:
Demonstrate how the power from a solar panel can change as the amount of light changes. You will develop this idea by measuring the amperage output of the solar panel for different light bulb outputs.
Tip:
Light output is listed on the bulb packages in terms of "Lumens". Lumens is not the same as Watts. Watts is the energy used. However, the lumens will generally increase with watts. For a consistent test you should choose all light bulbs from the same manufacturer.
Hypothesis:
A solar panel will deliver more power as it is exposed to increasing amounts of light.
Materials:
- Solar Panel
- 4 light bulbs with different light outputs. Different lumens values.
- Lamp for the light bulbs
- Multi-meter to measure Milli-Amps.
- Graph paper and pencil
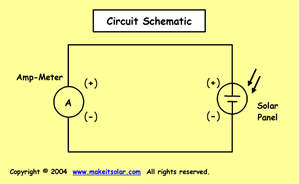
Schematic: (large image)
Set Up:
- Connect the ammeter to the solar panel and set the solar panel on a flat surface. Set the ammeter output so that it will read milli-amps (mA).
- Set up your lamp so that light will shine directly onto the solar panel.
- Be sure you will get a reading when you use the bulb with the lowest lumens. You may have to adjust the distance between the lamp and the solar panel.
Procedure
- Print out this work sheet or make your own.
Test 3 of the light bulbs with lumens values that are highest, lowest and 1 in-between.
- Put the bulb in the lamp.
- Turn on the lamp.
- Record the mA reading of your multi-meter.
- Graph your data for the 3 bulbs for mAmps (Y-axis) as a function of lumens (X-axis).
- Draw a line that will connect the 3 data points.
- Look at the line on your graph and predict the mA value of the remaining light bulb.
- Test the remaining light bulb and add that data point to your graph.
Expected Results:
The line will be fairly straight so you should be able to accurately predict the mAmp readings of other light bulbs based on the light output (lumens).
Try This:
- Try taking measurements outside in the Sun. Try it with and without clouds. Try it on a day that is partially cloudy and watch the change of your meter as the clouds move in and out of the path of the sunlight.
- You can find light bulbs rated at the same watts from different manufacturers that give off different amounts of lumens. Get 1 or 2 more light bulbs from different manufacturers that have the same watt rating but different lumens ratings. Use your graph to predict the mAmp output of your solar panel for these bulbs. Test the bulbs. How was your prediction? Why?


0 comments:
Post a Comment